
HP StorageWorks XP Performance Advisor Software v4.6 User and Troubleshooting Guide (T1789-96094, June 2010)

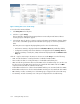
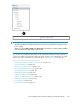
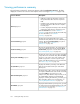
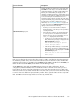
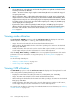
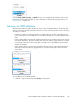
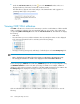

Figure 12 Array View screen for XP arrays
.
To view the above mentioned data:
1. Click Array View in the left pane.
2. Click the + sign for Arrays.
The list expands to display all the XP arrays that are monitored by XP Performance Advisor.
Custom groups (if created) also appear.
3. Select the XP array for which you want to view the performance and utilization summary details.
You can also select LDEVs grouped under individual custom groups to view their performance
data.
The Array View screen appears displaying data specific to the selected XP array.
• Performance summary is displayed under the Performance View tab (enabled by default).
• Configuration summary and volume distribution is displayed under the Summary View tab.
• Utilization summary of Cache, Bus, CHIP, and ACP are displayed under the Utilization Sum-
mary tab.
Click the + sign for an XP array in the Resource selection tree under Arrays to view the following:
• CHIP: Provides the data on overall performance of individual installed CHIPs.
• ACP: Provides the data on overall performance of individual installed ACP pairs.
• LDEV: Provides the performance data on all the LDEVs in the selected XP array. You can also view
the other resources like RAID groups and ports associated with these LDEVs. The list for LDEV
comprises all the CUs that are created in the XP array.
• FrontendIO: Provides the list of busiest frontend LDEVs and the ports associated with these LDEVs.
• BackendIO: Provides the list of busiest backend LDEVs and the ports associated with these LDEVs.
• RG Summary: Provides a summary view of the RAID groups configured in the selected XP array.
• Port Summary: Provides a summary view of the ports configured for the selected XP array.
Viewing XP arrays resources174