
HP StorageWorks XP Performance Advisor Software v4.6 User and Troubleshooting Guide (T1789-96094, June 2010)
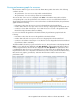
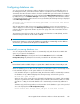

The performance graph also displays the Dispatch Threshold value that is the threshold value for which
an alarm was configured to be dispatched. The Dispatch Threshold value is displayed for only one
resource and metric combination. It is disabled if you choose multiple resources and metrics. The
Dispatch Threshold value acts like a watermark and helps you know the maximum threshold limit that
was set and the current performance value of the resource. Appropriate legends are displayed to
differentiate the resource current value from the Dispatch Threshold value. In the above figure, the
green line signifies the Dispatch Threshold value. After the performance graphs are plotted, you can
use the following chart options in the Chart Work Area. In addition, you can also resize and rearrange
the chart windows in the Chart Work Area. For more information on using the chart options, see
“Plotting charts” on page 213.
Related Topics
See the following related topics:
• “Understanding alarms history” on page 135
• “Alarm History screen” on page 136
• “Filtering records in Alarms History table” on page 138
• “Forecasting THP pools' utilization” on page 142
• “Adding or removing metric values” on page 121
• “Configuring notification and monitoring settings” on page 123
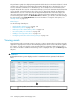
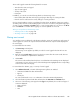
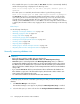
Viewing events
XP Performance Advisor generates events in response to various activities that you perform using this
application. Appropriate records are automatically displayed for all the events in the Event Log table.
For instance, records are logged for events generated when a performance data collection fails or
the collection schedule is restarted. The Event Log screen is displayed when you click Event Log in the
left pane.
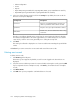
IMPORTANT:
By default, the Event Log screen displays records for events that have been generated in the last 24
hours.
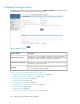
Event Log table, where all the events generated are displayed.1
Configuring alarms and managing events144