
HP StorageWorks XP Performance Advisor Software v4.6 User and Troubleshooting Guide (T1789-96094, June 2010)

Forecasting THP pools utilization
XP Performance Advisor enables you to forecast percentage of THP pool utilization for the next one
week or one month. It also allows you to determine when a THP pool utilization can cross the next
threshold level, and when an alarm be generated. For more information, see “Forecasting THP's
performance” on page 371.
IMPORTANT:
• You can forecast percentage of utilization only for THP pools.
• The Forecast list is displayed on the Alarm History screen only when you select the Utilization
metric for a THP pool.
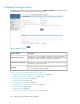
To forecast percentage of utilization for a THP pool:
1. Click Alarms in the left pane and select the Alarms History tab on the Alarms screen.
The Alarms History screen appears.
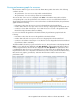
2. Select Forecast Week or Forecast Month from the Forecast list. By default, No Forecast is selected.
Based on your selection and the percentage of utilization of a THP pool, XP Performance Advisor
appends the forecast information to the email notification that is sent when an alarm is generated.
This forecast information provides the time when the THP pool utilization cross the next threshold
level. Following is a sample email notification that has the forecast information appended to the
email notification text:
From: TestAlarmForTHPoccupancy@hp.com [mailto:TestAlarmForTHPoccupancy@hp.com]
Sent: Thursday, August 28, 2008 12:57 PM
To: ABC
Subject: XP Alarm
tServer=ManagementStation1
Sequence_Number=20
Alarm_Source=Performance Advisor
Alarm_Major_Type=LDEV Total IO – Frontend
Alarm_Minor_Type=(LEVEL,1)
Alarm_Metric_Value=1:01
Array_ID=10009
Array_Type=XP24000
Detect_Level=Level_1
Actual_Value=30697
Threshold=30000
Time_Detect=2008-08-28 07:24:00 GMT
Forecasted Time for the next Level to Hit ===>=Thu Aug 28 12:18:00 IST 2008
Related Topics
See the following related topics:
• “Understanding alarms history” on page 135
• “Alarm History screen” on page 136
• “Filtering records in Alarms History table” on page 138
• “Viewing graph of metric value's performance” on page 143
• “Adding or removing metric values” on page 121
• “Configuring notification and monitoring settings” on page 123
Configuring alarms and managing events142