
HP StorageWorks XP Performance Advisor Software v4.6 User and Troubleshooting Guide (T1789-96094, June 2010)

NOTE:
• When you select a resource in the Resource selection tree for an XP array, the corresponding set
of records are displayed both in the Alarms table and the Alarms History table.
• You can also select multiple resource types or resources belonging to different XP arrays or custom
groups. Use the Shift or Ctrl key for selecting multiple resources. You can also search for a partic-
ular resource in the Resource selection tree. For more information, see “Searching for resources
in resource selection tree” on page 133.
• It is not mandatory to use the first level of Alarm History filters. The first level of filters are only
used to filter the existing set of Alarm History records for specific resources, so you can further
search a minimum set of records.
The records in the Alarms History table are automatically filtered to display the set of records
corresponding to the selected resource. Following are few examples:
• If you select Front-end > CHA (8) under XP array, 10055, only the 8 CHIP IDs that belong to CHA
(8) are displayed in the Alarms table.
• If you select Front-end > CHA (8) > E > MP > CHP00–1E > Port > CL1A under XP array, 10055,
only records for CL1A are displayed in the Alarms table.
• If you select XP array, 10055, only the record pertaining to that XP array is displayed in the Alarms
table.
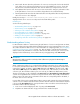
Filtering based on Alarm History filters
After filtering the existing set of records in the Alarm History table for specific resources, you can
further filter them using the second level of filters, the Alarm History filters, which further refines the
search and provides specific results. To filter alarm history records based on Alarm History filters:
1. Click Alarms in the left pane and select the Alarms History tab on the Alarms screen.
The Alarms History screen appears.
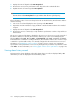
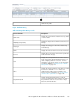
2. Filter and view resource records based on the following options. For description on each of the
filters, see “Alarm History filters” on page 140:
• Time Stamp list: Displays the time stamps for records posted, updated, and notifications dis-
patched.
• Level list: Displays the range of set threshold levels.
• Error Status list: Displays the type of errors generated when alarm notifications are not
triggered.
• Metric list: Displays the metrics for which resources are selected to be monitored and alarms
configured on them.
If you have used the first level of filters, the Metric list displays only those metrics that were
selected for the resources.
• Alarm Type list: Displays the type of alarms that are generated.
• Start Time, End Time: Start and end time for the selected time stamp.
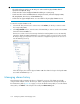
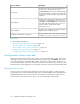
3. Click Filter. XP Performance Advisor filters the existing set of records and displays only those that
match the selection criteria on the Alarm History screen. The records are displayed in an ascending
order. For more information on Alarms History screen, see “Alarm History screen” on page 136.
Click Clear Filter any time while selecting values from the filter options to remove the current
selection and restore the default values.
HP StorageWorks XP Performance Advisor Software User Guide 139