
HP StorageWorks XP Performance Advisor Software v4.6 User and Troubleshooting Guide (T1789-96094, June 2010)
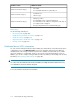
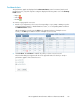

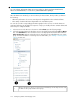

3. Select the check box for the metric, for which you want to view the performance graph of the
selected resource, and click OK.
XP Performance Advisor plots appropriate performance graphs in the Chart Work Area. The
duration for which the data points are plotted in the chart depends on the threshold duration
specified on the Threshold Settings screen. By default, the performance graphs are plotted for
data points collected in the last 6 hours of the management station's time.
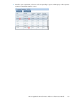
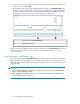
Chart window in the Chart Work Area.1
Zoom Preview panel.2
After the performance graphs are plotted, use the chart options in the Chart Work Area to perform
additional activities on charts. For more information on using the chart options, see “Plotting
charts” on page 213.
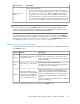
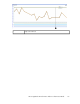
High watermark in dashboard charts
Every chart in the Dashboard Chart Work Area section shows a high water mark. The high water
mark is an indication of the maximum average usage value of that resource in the past 24 hours.
High watermark is displayed after considering the usage data of a resource in the last 24 hours for
a selected metric.
IMPORTANT:
• High watermark is applicable only for resources belonging to Frontend, Cache and Backend cat-
egories. It is not applicable for LDEVs.
• High watermark is displayed for only one resource and metric combination. It is disabled if you
choose multiple resources and metrics.
Monitoring the XP array performance116