
HP StorageWorks XP Performance Advisor Software v4.6 User and Troubleshooting Guide (T1789-96094, June 2010)
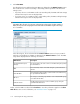
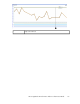


Dashboard charts
The performance graphs are displayed in the Charts Work Area section for Frontend, Cache, and
Backend resources, only if the respective categories display the following status icons in the XP Array
Health section:
•
Major ( )
•
Critical ( )
•
Normal ( )
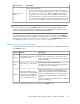
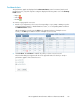
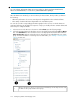
To view the usage graph for a resource:
1. Based on your requirement, select a record corresponding to a port, CLPR, or RAID group in the
respective Frontend, Cache, or Backend Statistics section, or a corresponding LDEV record from
the LDEV Information section.
While selecting the records, press the Shift key for sequential selection of multiple resource
records, or the Ctrl key for random selection of multiple resource records.
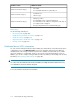
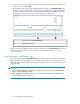
2. Click Plot Chart. The Plot Chart is enabled only when you select a resource record.
The Plot Chart dialog box appears with the list of supported metrics for which you can plot
performance graphs of the selected resource.
HP StorageWorks XP Performance Advisor Software User Guide 115