
HP StorageWorks XP Performance Advisor Software v4.6 User and Troubleshooting Guide (T1789-96094, June 2010)
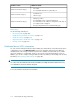
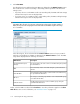
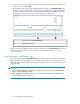

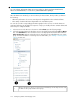

2. Click Show LDEVs.
Accordingly, the busiest and least busiest X LDEVs are displayed in the LDEV Information section.
The records are also sorted in ascending or descending order as specified on the Threshold
Settings screen.
• If you have chosen to sort the LDEV records in an ascending order, the LDEVs with least average
read and write response time are displayed first.
• If you have chosen to sort LDEV records in a descending order, the LDEVs with high average
read and write response time are displayed first.
IMPORTANT:
If the LDEV data collected is for XP array configurations involving 54K or higher number of
LDEVs, the response time to display the most and least busiest X LDEVs may be in the range
of 1 to 5 minutes.
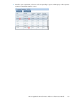
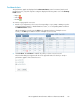
In the above figures, the record selected in the Frontend Statistics section is for port, CL3E for
which the corresponding set of LDEVs are displayed in the LDEV Information section. The LDEV
usage data is displayed for the following set of metrics:
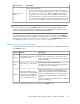
DescriptionLDEV metrics
The average latency for reads or writes on the LDEV during the specified
threshold duration.
Avg Read/Write Response
Time(ms)
The frontend IO/s made on the LDEV during the specified threshold
duration.
IOPS
The frontend throughput in MB/s read and written to the LDEV during
the specified threshold duration.
Block IO MBPS
The average overall raid group utilization of an individual RAID group
associated with the LDEV.
RG Util %
The IO/s happening between cache and RAID groups during the
specified threshold duration.
Backend Transfer
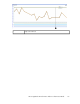
Further, select the LDEV records and click Plot Charts to view their performance graphs in the Chart
Work Area section. For more information, see “Dashboard charts” on page 115.
Monitoring the XP array performance114