
HP StorageWorks XP Performance Advisor Software v4.6 User and Troubleshooting Guide (T1789-96094, June 2010)
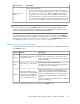


DescriptionResource levels
Can include the following:
• Resources that have the usage nearing the set threshold limits. It means that
their usage corresponding to a particular metric is at 95% of the set threshold
limit. The status icon in such cases is displayed as in the appropriate cat-
egory, if there are no other resources that are over utilized in that category.
• Resources that have the usage within the set threshold limits. The status icon in
such cases is displayed as in the appropriate category, if there are no other
resources that are over utilized or nearing set threshold limits in that category.
Resources shown as
Black text
NOTE:
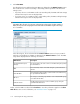
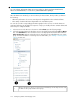
You can sort resource records in the Statistics section based on their current state. All the resource
records are sorted to display those resources that are over used (critical) followed by other resources
with their corresponding usage nearing or within the set threshold limits.
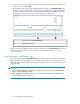
For a particular Frontend, Cache, or Backend category, you can select resources in the Statistics
section and view their performance graphs for associated metrics. You can also view the maximum
and least X busiest LDEVs associated with a port or RAID group, in the LDEV Information section. For
more information, see “Dashboard busiest LDEVs information” on page 112.
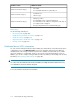
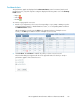
Dashboard categories and threshold metrics
The following table lists the metrics that are displayed for the Frontend, Cache, and Backend categories
in the Statistics section:
DescriptionMetricsCategory
Avg Port IOPS, Avg Port MBPS: Average of the IO/s and
MB/s usage on individual ports in the array Frontend.
Avg CHA MP Util (%): Overall utilization of the individual
MPs on each CHA.
Avg Port IOPS, Avg Port MBPS, and
Avg CHA MP Util (%)
Frontend
Cache utilization and write pending data.
In addition, the Side File Usage (%) data and the Cache
Size (total in MB) are also displayed.
Cache Usage (%), Write Pending
(%)
Cache
RG Seq Reads (IOPS) (Avg Seq Reads), RG NonSeq Reads
(IOPS) (Avg NonSeq Reads), RG Writes (IOPS) (Avg
Writes): Average of the frontend sequential and random
IO/s on an individual RAID group in the XP array backend.
Avg RG Util (%): Overall utilization of individual RAID
groups.
Avg DKA Pair Util (%): Overall utilization of the individual
MPs on each DKA pair.
RG Seq Reads (IOPS) (Avg Seq
Reads), RG NonSeq Reads (IOPS)
(Avg NonSeq Reads), RG Writes
(IOPS) (Avg Writes), Avg RG Util
(%), and Avg DKA Pair Util (%)
Backend
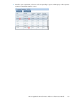
The following additional details are also displayed in the Statistics section:
HP StorageWorks XP Performance Advisor Software User Guide 111