
HP StorageWorks XP Performance Advisor Software v4.6 User and Troubleshooting Guide (T1789-96094, June 2010)
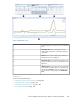
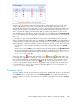

The Statistics section shows usage data for only those categories that have the following configured
on the Threshold Settings screen:
• Threshold limits is configured for associated metrics.
• Threshold duration is specified. If not, the Statistics section displays the usage data of resources
for the default threshold duration of 6 hours.
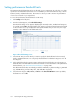
If threshold limit is configured for at least one metric in a particular category, the respective Statistics
section displays the usage data of individual resources for that metric and also other associated
metrics. The usage data displayed is not limited to the metric for which the threshold limit is set.
However, the resource usage levels are determined after comparing their usage data with the set
threshold limits.
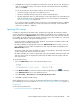
For example, you have set the threshold limit for only the RG Seq Reads (IOPS) (Avg Seq Reads)
metric in the Backend category. The status icon displayed in the XP Array Health section under Backend
category is based on whether the usage data of individual resources for RG Seq Reads (IOPS) (Avg
Seq Reads) metric is within or beyond the set threshold limit set. However, when you click the status
icon under the Backend category, the usage data of resources displayed in the Statistics section still
includes data for the following backend metrics. It is in addition to the usage data of individual
resources displayed for the RG Seq Reads (IOPS) (Avg Seq Reads) metric:
• RG NonSeq Reads (IOPS) (Avg NonSeq Reads)
• RG Writes (IOPS) (Avg Writes)
• RG Util (%)
• Avg DKA Pair Util (%)
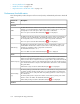
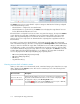
Knowing resource level in Statistics section
When you click a status icon in the Frontend, Cache, or Backend category, the related resource usage
data is displayed in the Statistics section. The resources can belong to one of the following for the
specified threshold duration:
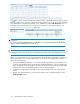
DescriptionResource levels
Indicates that the utilization of resources corresponding to a particular metric is
beyond the set threshold limit. The status icon in such cases is displayed as for
the appropriate category in the XP Array Health section.
For example, appears in the Frontend Statistics section for a port or CHA MP,
or both if their usage has crossed the set threshold limits.
Resources with a red
status icon beside them
( )
Monitoring the XP array performance110