
HP StorageWorks XP Performance Advisor Software v4.6 User and Troubleshooting Guide (T1789-96094, June 2010)

The status icons are displayed under the Frontend, Cache, and Backend categories based on the
usage of individual resources for the corresponding XP array. The appropriate status icons are
determined after comparing the usage data of resources against the threshold limits specified for the
respective Frontend, Cache, or Backend metrics. Even if the threshold limit is specified for only one
metric in a particular category, XP Performance Advisor provides usage data of resources for the
other related metrics in that category. However, the status icon to be displayed in the XP Array Health
section is decided based on the usage data of individual resources for that metric, for which threshold
limit is set.
For example, you have set the threshold limit for only the RG Seq Reads (IOPS) (Avg Seq Reads)
metric in the Backend category. The status icon displayed in the XP Array Health section under Backend
category is based on whether the usage data of individual resources for RG Seq Reads (IOPS) (Avg
Seq Reads) metric is within or beyond the set threshold limit. As a next step, you can do the following:
• Click the status icon in the Backend category and view the corresponding data in the Statistics
section.
• Select resources in the Statistics section and plot their performance graphs in the Chart Work Area
for the supported Backend metrics. The graphs provide the performance trend of those resources
during the specified threshold duration. For more information on threshold metrics, see “Performance
threshold metrics” on page 104.
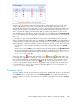
Further, the status icon, (Critical) takes precedence over (Major) and (Normal) status icons.
For example, the usage levels of majority of resources in the Frontend category are either at normal
level or almost reaching the set threshold limits for an XP array. However, the overall status for the
XP array in the Frontend category still shows as (Critical). It means there may be one or more
resources in the Frontend category with the corresponding usage levels above the threshold limit set
for a particular metric. Such resources need your immediate attention. For more information, see
“Dashboard statistics” on page 109.
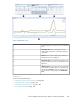
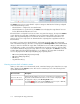
Dashboard statistics
The usage statistics of an XP array under the Frontend, Cache, and Backend categories are displayed
in the Statistics section. Click a status icon in the XP Array Health section under Frontend, Cache, or
Backend categories to view the associated resources and their usage data in the respective Statistics
section.
HP StorageWorks XP Performance Advisor Software User Guide 109