
HP StorageWorks XP Performance Advisor Software v4.6 User and Troubleshooting Guide (T1789-96094, June 2010)

DescriptionSections
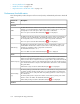
Based on your selection in the Statistics section, displays the maximum and least
X busiest LDEVs associated with the Frontend or Backend resources, where X is
configurable. For more information, see “Dashboard busiest LDEVs
information” on page 112.
LDEV Information
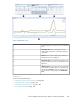
Displays a graphical representation of the performance of a resource for the selected
metrics.
You can view the graph for any resource that has the usage within or beyond the
set threshold limit. For more information, see “Dashboard charts” on page 115.
Chart Work Area
IMPORTANT:
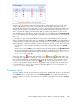
You can also view the license status on the Dashboard screen. The Click here to Add New Licenses
takes you to the License screen, where you can add new licenses for XP arrays. For more information,
see “Installing licenses” on page 32.
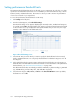
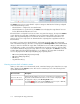
The overall usage summary for an XP array is derived based on usage of individual resources in the
Frontend, Cache, and Backend categories. XP Performance Advisor compares the resources usage
data with the set performance threshold limits, and displays appropriate status icons in the XP Array
Health section. The usage data of resources is displayed for the threshold duration of 24 hours, 12
hours, or 6 hours, as specified on the Threshold Setting screen. After the threshold limits are specified
and the duration is selected for an XP array on the Threshold Settings screen, XP Performance Advisor
does the following:
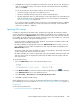
1. Monitors the usage of every resource belonging to the XP array and retrieves the following values:
• Average overall IO/s, MB/s on individual ports.
• Average overall utilization of MPs belonging to a CHA.
• Cache usage (%) and writes pending (%).
• Average sequential backend read tracks on individual RAID groups.
• Average non-sequential backend read tracks (also known as random backend reads) on in-
dividual RAID groups.
• Average overall utilization of a RAID group.
• Average sequential backend write tracks on individual RAID groups.
• Average overall utilization of an DKA pair.
2. Compares the usage values with the threshold values that you already specified for the Frontend,
Cache, and Backend metrics on the Threshold Settings screen.
3. Displays the appropriate status icons under the Frontend, Cache, and Backend categories in the
XP Array Health section for the respective XP arrays.
You can view the performance graphs of Frontend, Cache, or Backend resources in the Chart Work
Area. You can also view the maximum and least X busiest LDEVs associated with the resources, in
the LDEV Information section. For more information on setting performance threshold limits and
specifying the LDEV settings, see “Setting performance threshold limits” on page 102.
Monitoring the XP array performance106