
HP StorageWorks XP Performance Advisor Software v4.6 User and Troubleshooting Guide (T1789-96094, June 2010)
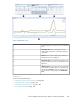
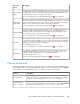
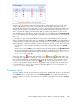
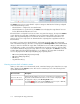

Figure 8 Dashboard screen
.
Threshold Settings screen, where you set the threshold
levels.
1
XP Array Health section, where status icons are
displayed that indicate the overall usage summary of
an XP array.
2
Statistics section, where average usage summary of
individual resources are displayed.
3
Chart Work Area, where graphs depicting the usage
pattern of individual resources for selected metrics are
displayed.
4
LDEV Information section, where the busiest and least
busiest LDEVs associated with the port or RAID group
(selected in the Statistics section) are displayed. You
can also plot their usage graphs in the Chart Work
Area.
5
Related Topics
See the following related topics:
• “Setting performance threshold limits” on page 102
• “Specifying LDEV settings” on page 103
• “Performance threshold metrics” on page 104
• “Viewing Dashboard” on page 105
HP StorageWorks XP Performance Advisor Software User Guide 101