
HP StorageWorks XP Performance Advisor Software v4.6 Release Notes (T1789-96097, June 2010)


The utilization status of CHA, CLPR write pending, DKA, and RAID group are measured against the
default or the threshold values you set on the Threshold Settings screen (Settings > Threshold Settings).
Based on the resource utilization, the status icons are displayed for MP Util (%), Write Pending (%),
DKA Util (%), and RG Util (%) on the Dashboard and Troubleshooting screens.
Forecast key XP Disk Array performance parameters based on their historical
usage patterns
In addition to XP Thin Provisioning (ThP), you can also forecast the utilization of the following resources
in Charts:
• MP Util (%)
• Write Pending (%)
• DKA Util (%)
• RG Util (%)
• ThP Util (%)
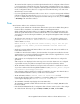
Depending on the current data points, you can forecast for any duration (a day, week, month, six
months, or a year) and measure it against the default threshold values or the values that you set on
the Threshold Settings screen. In a utilization forecast graph, the threshold value is displayed as a
blue reference line and the forecast is shown as a green line.
Resource tuning by identifying average read and write response variations for
an LDEV
You can identify the LDEV that is experiencing variations in its response time by analyzing the LDEV's
read and write response time values for the duration that you specify on the Data Analysis Settings
screen (Settings > User Settings > Data Analysis Settings).
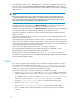
XP Performance Advisor analyzes the previous average read and write response values of an LDEV
for the duration you specified. Based on the actual data for the specified duration, it computes a
reference value (displayed as a blue horizontal line on the chart) and compares the average read
and write response values of an LDEV with the reference value. If the values are high, it displays a
blue arrow for the corresponding LDEV in the LDEV table. On clicking the blue arrow, the LDEV
average read and write response time graph appears, which displays the variations in the average
read and write response time of the selected LDEV.
XP Performance Advisor also displays the duration when the variations were observed. The durations
and the corresponding dates when the load was high on the LDEVs are displayed in a table. If you
do not want to view the table, clear the Show Peak Load check box in the Chart Work Area.
You can view performance graphs related to other metrics and analyze the cause of performance
load on LDEVs.
Generating or scheduling reports for favorite charts
In addition to viewing your favorite charts, you can also generate or schedule reports for your favorite
charts on the Reports screen (Reports > Create/Schedule Reports). The reports contain the performance
graphs for the combination of resources and metrics saved in your favorite charts. You can also select
the duration for which you want to view the performance graphs of the resources.
6