
HP StorageWorks Performance Advisor XP Software user guide (T1789-96025, October 2007)


5AlarmHistory
Introduction
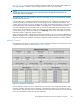
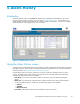
The Alarm History screen on the Events tab displays data compiled from the database. This screen
provides a history of XP array alarm events, as shown in Alarm History screen. Trapped alarms are
alarms that the system has generated over time a n d has stored in the database. You can view trapped
alarm information, including type, level, time, and status.
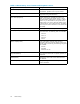
Figure 22 Al arm History screen
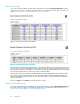
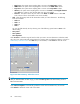
Using the Alarm History screen
The upper por tion of the Alarm History screen displays columns of information about performance alarms,
including array type, metric category, threshold, and status of dispatched alarms. For more information
about these item s, see Components of the Alarm History screen .
Use the fields in the lower portion of the screen to specify or filter the information that you want to
receive. The fields provide option buttons or drop-down menus to quickly identify and select data.
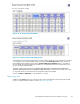
The following drop-down menus are available:
• DKC/Group: A list of the arrays that the system is monitoring or groups that have generated
alarms.
• Metric Cat: A list of the metric categories that are being monitored. The items i n the list depend
on the array that the system is monitoring. The following categories are available:
• Total IO
• Total MB
• Maximum Port IO
• Error Status: The following selections are available to monitor error status:
HP StorageWorks Performance Advisor XP Software user guide
47