
HP StorageWorks Performance Advisor XP Software user guide (T1789-96025, October 2007)
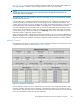
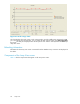
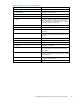

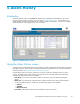
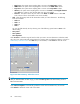

Figure 21 C
ache usage chart
The chart d
isplays the cache usage, cache writes pending, and the sidefile usage measured in (MBs
per 5 seco
nds) for the selected array. You can select the date and time range using Date/Time Filters,
the maxim
um data points displayed from the drop-down menu and the chart style from the Chart style
drop-down menu.
Refreshing informatio n
Information for the Array View screen is retrieved from the database every 4 minutes and displayed in
the tables.
Components of the Array View screen
Table 13 lists the components that appear on the Array View screen.
44 Array View