
HP StorageWorks Performance Advisor XP Software user guide (T1789-96025, October 2007)
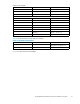
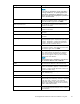

• Serial Number: The serial number of the XP array
• Microcode Version: The array firmware version of the XP array
• RmLib Version: The Raid Manager Library version installed on the host machine*
• DKC Time: The timestamp of when the latest performance data collection for the D KC compon ent
completed
• Raid Group Time: The timestamp of when the latest performance data collection for the Raid
group component/s completed
• Port Time: The timestamp of when the latest performance data collection for the Port component/s
completed
*Ifconfiguration d ata collection is done through the out band mode, the RmLib Version displays zero.
For details on the out band mode see Collecting configuration data.
NOTE:
If you view data from multiple XP disk a rrays in the Array View screen, there can be a delay in loading
the data. PA XP waits until data from all expected arrays is collected before it displays the data.
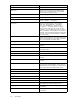
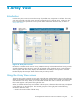
Click the General group box to view the Utilization Summary report for the selected array.
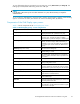
The Array Frontend Total box displays all port activity taking place on the frontend. The port activity for
a CHIP is the sum of all the por t activities on that CHIP. The array frontend is the sum of all CHIP port
activities. Click the Array Frontend Total group box to view the details of the 10 busiest LDEVs/Ports.
The Array Backend Total measures the backend transfers. Individual ACP pairs provide the array backend
total. The array backend is the sum of all ACP pair activities. Click the Array Bac kend Total group box to
view the details of the 10 busiest LDEVs/RAID groups.
Click the Cache group box to view the Cache usage chart. It displays the cache usage metrics for
the selected array, in a chart format.
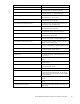
The CHIP Port Activity section shows CHIP status for the array, and the ACP Pair summa ry screen shows
ACP Pair status for the a rray.
On the left pane, click CHIP in the Array View tree, to view multiprocessor (MP) utilization and port
activity of all the CHIPs installed. Clicking on a individual CHIP displays its summa ry, MP utilization, port
activity, the port I/O details and the port MB details.
Click ACP Pair in the Array View tree to view the MP utilization and backend transfers for all the ACP
pairs installed.
Clicking on an individual ACP Pair displays its MP utilization and backend transfers a nd the RAID Group
information for the ACP Pair. If R AID Groups belonging to the same AC P pair are distributed across
two data collection schedules for an array, the Array View screen shows only the latest R AID Group
performance data, collected by either of the schedules.
All the metrics display the latest data as received by the management station, from either of the schedules.
To know more about schedules, see Data Collection Configuration.
Viewing the data
Each component displays the current value either in IOs or MBs, and displays a bar that represents
the maximum possible value.
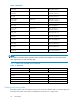
Each component is measured in megabytes used over the amount of cache installed. The maximum cache
memory is 16 GB for an XP256 array; 32 GB for XP128, XP512, XP48, and XP10000 arrays; 64 GB for
an XP1024 array; 256 GB for XP12000 and XP24000 and 128 GB for XP20000.
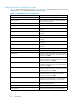
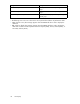
TheXP10000diskarrayandtheSVS200appliancehaveamixPCBconfiguration. The two
configurations, MIX-A and MIX-F, have four CHIP MPs and four ACP MPs on the same processor board.
Ther e can be two mix PCB configurations for the array. The mix PCB shows four MPs in the CHIP section,
which serve as CHIPs and four MPs in the ACP section which serve the AC P functionality, as shown in
40 Array View