
HP StorageWorks Performance Advisor XP Software user guide (T1789-96025, October 2007)
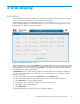
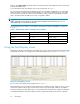
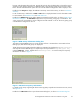
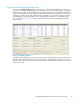
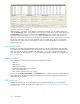
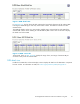
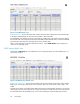
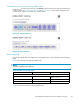
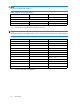

Figure 6 Port Data dialog box
Click IO/s Chart or MB/s Chart to display the Performance History screen. You can view the data in any
of the following Chart Style from the drop-down menu:
• bar chart
• line chart
• stackable chart
The Grid Display screen will not display hot links for concatenated ACP pairs in the ACP Pair ID and
ACP Pair Util fi elds. Hence no chart for the same can be created.
Ta bl e 3 Grid Display screen drop-down m enus
Drop-down Menu
Description
Show Array
Shows a specific array or all arrays.
Show Host
Shows a specific host or requested hosts.
Show RAID G roup
Enter the physical location of the drive.
Show Host Group
Shows a specific host group or all host groups.
Show CHP Port
Shows a specific CHP Port or all ports.
Show ACP Pair
Shows a specific ACP pair or all ACP pairs.
Show Volume Group
Shows a specific volume group or all volume groups.
Show LUSE
Shows a specificLUSEorallLUSEs.
Show SLPR Group
Shows a specific SLPR group or all groups.
Show CLPR Group
Shows a specific CLPR group or all groups. The Grid Display
screen displays only those CLPRs that have Parity Groups
assigned to them.
Show Journal Group
Shows a specific Journal Group or all groups.
Display Type
Shows the display type, whether mainframe, open systems, or
both. This feature is enabled only when the data that you are
collecting is a mixture of mainframe and open systems.
Summary by
Provides an overall summary of each RAID group or port on a
given array. See the section below for more information about
this menu option.
24
Grid Display