
HP StorageWorks Performance Advisor XP Software user guide (T1789-96025, October 2007)


For charts with a sync error, that is when more than one graph is plotted, the start and end time is the
data range of the master graph which resulted in the sync error.
For Daily and Weekly charts the start and end times are the start and end day.
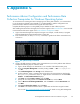
When charts are and are not plotted
Charts may or may not be plotted depending of certain factors. This section explains when charts are
plotted and with what data points, and when they are not plotted. It also explains the concept behind the
data points us
ed for plotting charts.
Char t is plotted
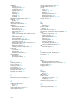
• Chart is plotted for all the arrays having data
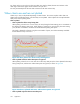
When plotting a chart for two or more arrays, the array having the latest starting point is considered as
the reference for plotting data points. When plotting a graph for two arrays having the same star ting
point, the first one added is considered as the reference for plotting data points.
The graph is plotted for all arrays using the exact number of points, and at the timestamps available
for the reference array as shown in .
Figure 85 C hart plotted for all the arrays having data
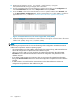
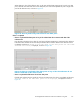
• Chart is plotted and items without data points are ignored
Whenplottingachartifoneormoreitemsdonothaveanydatapoints,thechartisplottedfortheitem/s
having data points, and the items without data points are ignored, as shown in Figure 86.
Figure 86 Chart is plotted and items with out data points are ignored
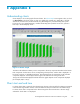
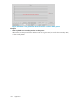
• C
hart is plotted only with reference item data point
156
Appendix E