
HP StorageWorks Performance Advisor XP Software user guide (T1789-96025, October 2007)
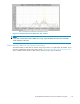
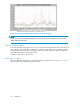
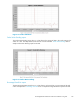
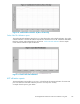
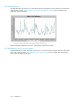
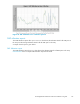
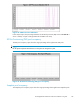
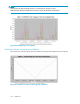

Figure 70 Percentage read hits
Total Backend Transfer report
The Total Backend Transfer report shows in a chart format, the total number of transfers, sequential,
random drive-to-cache, and cache-to-drive, per second. Total Backend Transfer report shows a sample
Total Back
end Transfer report for XP1024.
Figure
71 Total Backend Transfer report
Tota l Backend Transfer by Hour of the Day report
The Total Backend Transfer by Hour of the Day report shows in a chart format, the total number of
transfers, both sequential and rand om drive-to-cache transfers, and all cache-to-drive transfers, averaged
over 24-hour period. Total Backend Transfer by Hour of the Day shows a sample Total Backend Transfer
by Hour of the Day report for XP1024.
144
Appendix B