
HP StorageWorks Performance Advisor XP Software user guide (T1789-96025, October 2007)
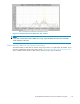
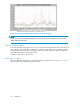
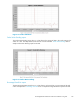
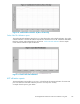
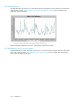
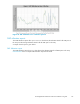
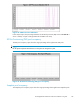
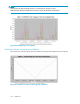

Figure 67 Total Frontend I/O Rate First Top 8 Array Groups
NOTE:
IfI/Oshaveoccurredforlessthen8LDEVSinanarray,onlythoseLDEVswhichhaveI/Osassociated
will be displayed in the chart.
Cache utilization reports
The cache utilization reports allow you to view in a chart fo rmat, the utilization of cache in the array, the
amount of data in the cache that is waiting to be written to a disk, read hits as a percentage of total
read operations, the total number of tra nsfers per second, the total number of transfers over 24-hours,
cache side file utilization for asynchronous CA.
A sample of e ach report is given below:
Cache Utilization report
The Cache Utilization report shows in a chart format, the cache utilization in a n array. Cache Utilization
shows a sample Cache U tilization report for XP1024.
142
Appendix B