
HP StorageWorks Performance Advisor XP Software user guide (T1789-96025, October 2007)
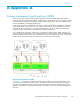
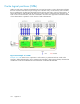
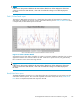
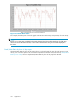
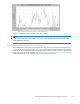
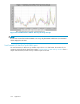

Figure 64 Total Backend I/O Rat e First Top 8 LDEVs
NOTE:
If I/Os have occurred for less then 8 LDEVS in an array, only those LDEVs which have I/Os associated
will be displayed in the chart.
Total Backend I/O Rate First Top 8 Array Groups report
The Total Backend I/O Rate First Top 8 Array Groups report shows in a chart format, the real backend
I/O rate for the busiest 8 Array Groups. This can be compared to the potential maximum throughput of
the h ardware. The maximum throughput varies d epending on RAID level, disk mechanism type and o ther
factorssuchasthesizeoftheindividualI/Os.Total Backend I/O Rate First Top 8 Array Groups shows a
sample Total Backend I/O Rate First Top 8 Array G roups report for XP1024.
HP StorageWorks Performance Advisor XP Software user guide
139