
HP StorageWorks Performance Advisor XP Software user guide (T1789-96025, October 2007)
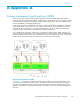
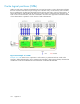
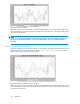
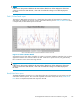
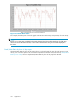
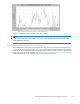
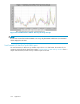

Figure 63 Read/Write Detail
NOTE:
If there are no data points available for the dates selected, blank chart will be displayed. If all the data
values are zero for the dates selected, a chart with a horizontal line along X axis will be di splayed in
the center.
LDEV IO reports
LDEV I/O reports allow you to view the 8 busiest frontend and backend LD EVs and array groups, along
with the I/Os on them. There are 4 re ports that can be generated to view this information, Total Backend
I/O Rate First Top 8 LD EVs, Total Backend I/O Rate First Top 8 Array Groups, Total Frontend I/O Rate
First Top 8 LDEVs, and Total Frontend I/O Rate First Top 8 Array Groups.
A sample of e ach report is given below:
Total Backend I/O Rate First Top 8 LDEVs report
The Total Backend I/O Rate First Top 8 LDEVs report shows in a chart format, the real b ackend I/O rate
of the busiest 8 LDEVs. This can be co mpared to the potential maximum throughput of the hardware. The
maximum throughput varies depending on RAID level and disk mechanism t ype and other factors such as
the size of the individual I/Os. Total Backend I/O Rate First Top 8 LDEVs shows a sample Total Backend
I/ORateFirstTop8LDEVsreportforXP1024.
138
Appendix B