
HP StorageWorks Performance Advisor XP Software user guide (T1789-96025, October 2007)
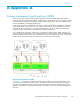
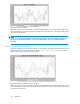
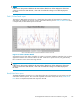
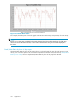
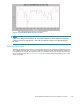
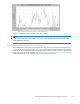
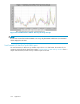

Figure 58 Total I/O Ra te
Total Back-end I/O may be compared to Total I/O and the difference is due to the effects of the array
cache. The B
ack-end I/O load is borne by the Array Groups and ACP pairs, whereas the Total IO load
is borne by the C HIP ports.
NOTE:
If there are no data points available for the dates selected, a blank chart will be displayed. If all the data
values are
zero for the dates selected, a chart with a horizontal line along X a xis will be displayed in
the center.
Total I/O Rate by hour of day report
The Total I/O Rate by hour of day report shows in a chart format, the number of total read and write I/O
operations per second over the over 24 -hour period. Total I/O Rate by hour of day shows a sample
Total I/O Rate by hour of day report for XP1024..
Figure 59 Total I/O Rate by hour of day
Total Back-end I/O may be compared to Total I/O and the difference is due to the effects of the array
cache. The Back-end I/O load is borne by the Array Groups and ACP pairs, whereas the Total I/O load
is borne by the C HIP ports.
134
Appendix B