
HP StorageWorks Performance Advisor XP Software user guide (T1789-96025, October 2007)
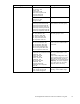
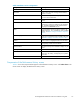

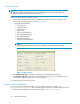

Ta b l e 31 Performance His tory screen com ponents
Component Description
Back/Forward (buttons) Use these four buttons to display data points not
currently displayed on the chart. These buttons
become available when the total data points retrieved
exc eed the maximum data points displaye d setting.
Bar Chart This view shows parallel bars that are graphed side
by side. The parallel display is useful for comparing
items within the same ti me period. Select two- or
three-dimensional views.
Chart Style (drop-down menu)
Alistofthechartstylesthatareavailableforyour
report.
Date/Time Filter (button) Click this button to specify the start and end times for
the sets of data that you want displayed.
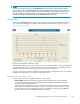
Line Chart This view illustrates the data points.
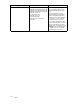
Max Data Points Displayed (drop-down menu)
Alistofthemaximumnumberofdatapointsthatare
available for your report.
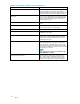
Stackable Chart This view shows stacked bars that are graphed on top
of each oth
er. Use the stacked display to compare
totals be
tween different time periods. Select two- or
three-di
mensional views.
Start Updating When updating is enabled, the system regularly
checks the database for new data. If new data is
found, the screen is updated with the newest da ta
point added to the right side of the graph. All other
data points are shifted one column to the left, a nd the
far left column is removed.
NOTE:
If the chart contains metrics from different arrays,
Start Updating is disabled.
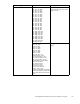
Total D
ata Points Retrieved
The total number of data points retrieved for this
chart. If this number exceeds the maximum data
points display setting, use the back and forward
buttonstoviewdatapointsnotcurrentlydisplayed.
118
Charts