
HP StorageWorks Performance Advisor XP Software user guide (T1789-96025, October 2007)
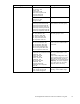
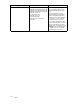
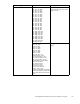
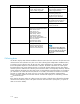
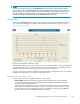
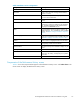
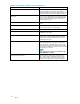

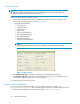

Table 30 Charts screen components
Component Description
Add Click to show se
lected metrics in a chart.
Add Trend
Click to show the rate of change of the selected
metrics in a chart.
Array/Group A list of the arrays and custom groups about which
you can receive information.
Clear Click to clear
all selections made on the Charts
screen.
CU
Lists the CU numbers. You must select a metric
pertaining to volumes to display the CU drop-down
list. The LDEVs belonging to the selected CU are
displayed in the Resources list box.
Metric
Alistthatfurtherrefines the selection made in the
Metric Category. For a complete list of the available
metrics, see Metric Category and M etric drop-down
menus.
Metric Category
Alistofthemetricsthatareavailablefortheselected
array. For a complete list of the available categories,
see Metric Category and M etric drop-down menus.
Remove
Click to remove a highlighted metric from the chart.
Resources
A list of possible components to chart based on the
Array/Group, Metric and CU selected.
Selected
Metrics
The metri
cs that you have selected t o display on your
chart.
Set Range
Click to filterthedatabytimeatthestartofthequery.
Set Times
Click to filter the data within a specificstartandend
time (up to 20 weeks), and frequency for a specific
time zone.
Show Chart
Click to
activate the chart for your selected metrics.
Components of the Performance History screen
Table 31 shows the components that appear in the Performance History screen. Click Show Char t in the
Charts screen to display the Performance History screen.
HP StorageWorks Performance Advisor XP Software user guide
117