
HP StorageWorks Performance Advisor XP Software user guide (T1789-96025, October 2007)
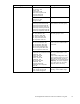
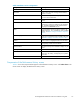


Metric Categ ory Metric Description
Cache Usage Util
Cache Writes Pending Util
Cache Sidefile Usage Util
Cache Usage Utilization, Cache
Writes Pe nding Utilization, Cache
Sidefile Usage Utilization
THP Pool Occup
ancy
The usage rate of a XP Thin
Provisioning (THP) pool.
The THP Pool Occupancy is
displayed only for XP24000.
SNAPSHOT Pool Occupancy
The usage rate of a S napshot p ool.
The Snapshot Pool Occupancy is
displayed only for XP 24000.
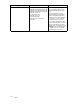
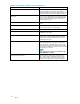
Utilization Metrics, cont.
Journal File Usage Util
The usage rate of a Continuous
Access J ournal File.
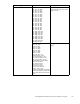
Backend Met
rics
LDEV Sequen
tial Read Tracks
LDEV Non-se
quential Read Tracks
LDEV Write
Tracks
RAID Group
Se-
quential R
ead Tracks
RAID Grou
pNon-se-
quential
Read Tracks
RAID Grou
pWriteTracks
ACP Pair
Sequential Read Tracks
ACP Pair
Non-se -
quenti
al Read Tracks
ACP Pai
rWriteTracks
Response Time Metrics
Average Read Response
Maximum Read Response
Average Write Response
Maximum Write Response
Single LDEVs
NOTE:
The Maximum Read Response
and Maximum Write Response
values are valid only for the last
30 seconds of the timestamp
displayed.
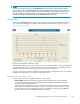
Colle
cting data
Use PA
XP to display data collected at different collection rates in the same chart as if all of the data were
collected at the same collection rate. (This occurs when collecting from multiple DKCs at different rates.)
To manage varying collection rates, PA XP uses cubic spline interp olation or approximation. The basis
for the interpolation depends on the m aster that is selected. The master will be the set of data p oints
that
represent the most recent collection period, as well as the shortest collection period. (The shortest
collection period is defined as the collection period where the data is most frequently collected.) After the
system determines the master, the other data points are interpolated to match the master. For example, if
you c
ollected a set of data at five-minute intervals on one DKC, and another set of data at one-minute
intervals on another DKC, the system will carry out its cubic spline interpolation (approximation)
based on the data collected at one-minute intervals. All data will display as if it were being collected
at o
ne-minute intervals.
If the data has the same number of collection points, the master will be the data collected from the DKC
with the s hortest collection period. The system will never return more than 1,00 0 points. (10 points of
dat
aaresetasthedefault.)
114
Charts