
HP StorageWorks Performance Advisor XP Software user guide (T1789-96025, October 2007)
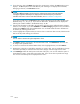
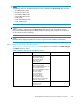
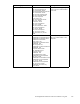

Ta ble 28 Ch art Screen Selections for XP1000 0/X P12 000 /X P24000/XP20000
Cache Partition ch arts
Array/Group
Metric Category Metric
Resource List Title
Resource List
Contents
Any disk array
model or serial
number
MB Metrics or
Utilization Metrics
Cache Usage Cache Partition All
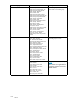
An XP 12000
serial number
MB Metrics or
Utilization Metrics
Cache Write
Pending or Cache
Sidefile Usage
Cache Partition All, 0, 1, 2, 3, ...
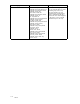
Anon-XP120
00
serial numb
er
MB Metrics o
r
Utilizatio
nMetrics
Cache Write
Pending or Cache
Sidefile Usa
ge
Cache Partition All
A custom group
name
MB Metrics or
Utilization Metrics
Cache Usage,
Cache Write
Pending, or Cache
Sidefile Usage
Cache Partition
Empty
NOTE:
The chart may show the utilization as zero for invalid MPs. This is because the mix CHIPs
and mix ACPs have only four MPs each. For example, if you select Utilization Metrics,
from the m
etric category combo b ox in the Chart screen for an XP10000, and then select
utiliza
tionforMP4,MP5,MP6,MP7formixACPPairs,mixACPsormixCHIPsfrom
the Metric combo box, the resultant chart displays zero utilization for those MPs because
theMPsareinvalidformixPCBS.
Chart will not display the utilization metrics for c oncatenated ACP pa irs.
TIP:
The individ ual CH I P utilization metric displays the average utilization of each MP in the
CHIP, the CHIP utilization per MP displays the utilization for each M P in the CHIP, and the
overall CHIP utilization chart displays the average utilization of each MP in the array.
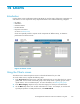
Workin
gwithgroups
You can
also create and chart groups of specific host and array components by creating a group in
the PA X
PGroupConfiguration screen on the Configuration tab. The Group Configuration screen is
aconfi
gurable Grid Display screen.
After
you select the parameters for your group, the system returns the results of your selections. For
examp
le, the system can add all the total IOs for invalid ACP Pairs, or it ca n add the LD EVs for a custom
RAID g roup. Ensure that you have selected every elem ent that you want to appear in the chart, because
the system can chart only those elements that are specified. After yo u create a group in the Groups screen,
the new group automatically appears in the Array/Group drop-down menu in the Charts screen. Use the
Metric Category and Metric drop-down menus to select the metrics that you want to chart for yo ur group.
106
Charts