
HP StorageWorks Performance Advisor XP Software user guide (T1789-96025, October 2007)
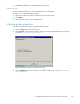
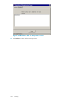
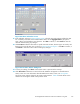
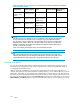
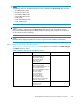

Figure 46 Chart Calendar s creen
11. In the calendar, as shown in Chart Calendar screen, select the start and end times to filter the data.
For a summary of all items in the Selected Metrics field, use the Aggregate data by drop-down
menu. When you finish making your selections. Click OK to continue, or click Cancel to close the
calendar
without making any changes.
12. Click Se
tTimesto filter the data within a specific start and end time, duration (up to 20 weeks), and
frequency for a specifictimezone,asshowninSet Time Va lues dialog box.ClickOK to continue, or
click Cancel to close the window without making any changes.
Figure 47 Set Time Values dialog box
13. Toclearyoursettings,clickClear on the Charts screen or proceed to the next step.
14. Click Show Chart. Information is retrieved from the database and appears in the Performance
History screen. For more information about the Per formance History screen, see Viewing data.
The Charts screen supports charts for XP 12000 c ache par titions. Table 28 lists the Chart screen
selections for showing XP 12000 cache partition charts.
HP StorageWorks Performance Advisor XP Software user guide
105