
HP StorageWorks Performance Advisor XP Software user guide (T1789-96025, October 2007)

14 Charts
Introduction
Use the Charts screen in Per formance Advisor XP (PA XP) to view the metrics of the array components in a
chart format. You can compare the array components based on and within the following categories:
• IO Metrics
• MB Metrics
• Utili zation Metrics
• Backend M etrics
• Response Time Metrics
as shown in Charts screen.
Charts are especially useful to compare similar components of different arrays, to determine
performance and observe trends
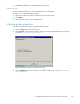
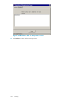
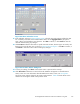
Figure 45 Charts screen
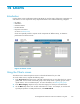
Using the Charts screen
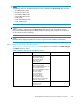
The Charts screen contains drop-down menus to select the information for your chart.
To use the Charts screen, complete the following steps:
1. In the Array/Group drop-down menu, select the customized group or array from which you want to
gather d
ata. You can create customized groups in the Groups screen. Typically, g roups contain
specifi
c metrics, su ch as invalid ACP pairs. For more information, see Working with groups.
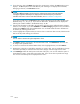
2. In the M
etric Category drop-down menu, select the category for which you want information.
3. Use the
Metric drop -down menu to refine information for a metric. For example, to view the total
input-output operations on LDEV per formance, select LDEV Total IO.
HP StorageWorks Performance Advisor XP Software user guide
103