
HP StorageWorks Advanced Web Tools 7.4.X Administrator Guide (AA-RVHFC-TE, September 2005)


86 Monitoring performance
Configuring performance charts
The number of charts displayed depends on the chart configuration you select. You can select multiple
charts to be displayed or a single chart to display all the performance statistics.
The maximum number of charts that can be displayed is 16. If you select a combination of ports and
counters that results in a number of charts exceeding the maximum, an error message appears, asking you
to reduce the number of ports and counters selected. For example, if you select 10 ports and 2 counters
and then select the One chart per port and counter option, the resulting number of charts would be 20,
which exceeds the maximum. In this case, deselect some of the items (for example, deselect one counter) to
generate the allowable number of charts. Alternatively, select a different type of layout that results in fewer
charts being generated.
The maximum number of data sets that can be displayed is 32. A data set is defined as a line on a chart.
The number of data sets is determined by the following formula:
number_of_data_sets = number_of_counters * number_of_charts
For example, you can have 1 chart with 32 counters, or 8 charts with 4 counters each, or 6 charts with 5
counters each.
NOTE: The charts can display up to 16 different colors. If the number of data sets is greater than 16, the
colors are reused, and it might become difficult to distinguish between data sets.
Keep the chart and data set maximums in mind when selecting ports, counters, and chart layout in the
following procedure.
1. From the Switch Explorer, click the Perf icon in the Switch View or from the Switch Manager, click
Performance in the navigation bar.
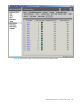
2. Click the Charts tab.
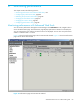
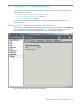
3. Click Configure Charts in the task bar.
The Configure Charts window opens.
4. Select the ports you want to appear in the chart displays.
5. Click Next.
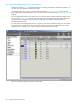
6. Select the types of counters to appear in the chart displays.
7. Click Next.
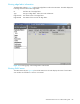
8. Select the type of layout to use for the charts:
• One chart per port displays a separate chart for each selected port. All selected counters are
included on each port chart.
• One chart per counter displays a separate chart for each counter type. All ports are included in
each chart.
• One chart per port and counter displays a separate chart for each counter type for each selected
port. Each chart includes one port and one counter for that port.
• One chart for all ports and counters displays a single chart that includes all selected ports and
counters.
9. Click the Enable Auto-Refresh box to automatically refresh the displays.
10.If you chose to turn on autorefresh, type the refresh interval in seconds.
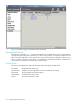
11.Click Finish.
The charts appear in the Charts tab. You can right-click a graph to zoom in and out, change the
properties of the graph, or print the graph.