
HP StorageWorks Advanced Web Tools 7.4.X Administrator Guide (AA-RVHFC-TE, September 2005)


Advanced Web Tools 7.4.x administrator guide 71
6 Using the event log
This chapter provides information on viewing the event log and contains the following sections:
• Event messaging in XPath OS, next
• Viewing the event log, page 72
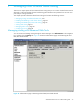
• Adding and deleting syslog hosts, page 73
Event messaging in XPath OS
Event messages provide information regarding the status of the switch and ports; each message has a
severity level. The event log saves all messages generated by the system since the last reboot. The persistent
event log saves messages in nonvolatile memory so that they are saved across reboots and power cycles.
Saving messages to the event log and saving messages to the persistent event log are examples of event
actions; another possible event action is reporting messages to the SNMP process. You can modify the
actions XPath OS takes when it receives an event message.
Event log
XPath OS maintains an internal event log of all diagnostic and system error messages. Each switch has its
own event log. By default, some critical events along with diagnostic events are saved to nonvolatile
memory, and all other messages are volatile. Messages not saved to nonvolatile memory are lost over
power cycles and reboots.
The event log is implemented as a circular buffer. When the internal buffers are full, new messages
overwrite old messages. For information on event log buffer limits, see the HP StorageWorks XPath OS
7.4.x system error messages reference guide.
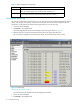
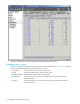
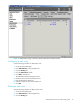
The Events page of Switch Manager displays event log messages. By default, the page displays all event
messages, both volatile event messages (saved in memory) and persistent event messages (saved in
nonvolatile memory). For details, see ”Viewing the event log” on page 72.
Event log message levels
There are six severity levels for event messages, ranging from Panic to Debug. Use the definitions in
Table 3 as general guidelines for troubleshooting. Review each event description thoroughly before taking
action.
Table 3 Event message levels
Event level Description
0 = Panic Panic messages indicate that a specific software subsystem has detected a fatal or
unrecoverable error condition. Examples are memory allocation failure, system call
failure, and software detection of problems with the ASIC or with hardware
subsystems. These errors usually indicate partial or complete failure of a subsystem.
1 = Critical Critical messages indicate that the software has detected serious problems that
eventually cause a partial or complete failure of a subsystem if not corrected
immediately. A power supply failure, for example, or a rise in temperature must
receive immediate attention. Some of the critical errors might overlap in severity with
the panic messages.
2 = Error Error messages indicate error conditions that do not significantly affect overall
system functionality. For example, error messages might indicate time-outs on certain
operations, failures of certain operations after retries, invalid parameters, or failures
to perform requested operations.
3 = Warning Warning messages highlight current operating conditions that should be checked
before they cause failures. For example, a power supply failure in a redundant
system relays a warning that the system is no longer operating in redundant mode,
and that the failed power supply should be replaced or fixed.