
HP StorageWorks Advanced Web Tools 7.4.X Administrator Guide (AA-RVHFC-TE, September 2005)

Advanced Web Tools 7.4.x administrator guide 17
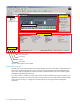
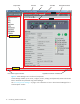
The Switch Manager window is divided into several areas that provide access to and information about the
MP Router and the fabric. You should familiarize yourself with these areas; the procedures in this guide
refer to them:
• Main window: Switch Explorer and Switch Manager each have a main window that exists for as long
as the component instance is running; they cannot be closed without quitting that instance of the
application. The title bar of the main window indicates which component of the GUI is running in that
window. If you quit the Switch Explorer instance, the Switch Manager continues to execute (and vice
versa).
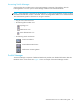
• Navigation bar: The navigation bar is located on the left side of the window and provides access to
management interfaces, such as Name Server, events, and zoning administration. Clicking an item in
the navigation bar displays the corresponding page in the Switch Manager main window.
• Pages: Switch Explorer and Switch Manager display information in pages. Pages are displayed in the
main window. A page can contain a table or other information. A page may also contain tabs. Tabs
are usually at the top of a page and provide a categorized view of information about objects shown on
the page. You can click a tab to view the display for that tab. There are two types of pages:
• Top-level pages are listed in the navigation bar. A page is displayed in the main window and
cannot be closed unless you select another page or quit the GUI application. When a page is
selected and displayed, the page name is highlighted in the navigation bar. To go to another
top-level page, click the page title in the navigation bar.
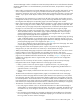
• Drill-down pages provide more detail about an object. You can open a drill-down page by clicking
a blue, underlined hyperlink. A port drill-down page can also be opened by clicking a port icon.
When you open a drill-down page, the page topic is added as a child page under the appropriate
parent (top-level) page option in the navigation bar (see Figure 4).
You can close a drill-down page by clicking the X in the upper right corner of the page. This results
in the child page title being removed from the navigation bar.
• Panes: Page tab contents are displayed in panes. A pane is the portion of the page display that
changes when you click a tab. Panes can contain any or all the elements of a page.
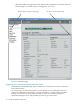
• Tables (not illustrated): Many pages and panes contain tables of information. You can click a column
head in a table to sort the order of the table rows according to the entries in that column.
• Hyperlinks: When an item is displayed in blue underlined text, you can click it to open the drill-down
page to see more detailed information about that item. For example, in Figure 3 on page 16, the
enabled zone configuration name is a hyperlink that, when clicked, opens the zone configuration
drill-down page.
• Caption bar: This is at the top of each window; it displays the title for the current top-level page.
• Navigation buttons: Three navigation buttons are at the top right of each window:
• Back (<): Click to return to the previous page. It is grayed out if there is no previous page.
• Forward (>): Click to return to pages from which you have navigated using the Back button. It is
grayed out if there is no next page.
• Help (?): Click to display context-sensitive instructions on how to use the current page, pane, or
window.
The Back and Forward buttons navigate between pages, but not between tabs on the same page.
• The task bar is below the page tabs and contains option buttons for the operations you can perform
from that page. Typically, clicking an option button displays a dialog box, which guides you through
the selected operation. Some task bar buttons are always enabled, some are enabled only when you
have selected items on the page, and some are enabled only when certain conditions are met for the
items selected. (For example, the Start Port task button is enabled only if the selected port is stopped.)
• The status bar is at the bottom of the window; it is divided into three sections:
• Error and progress indicator: This is on the left side of the status bar. When Switch Manager is
sending data to or retrieving data from the MP Router, this indicator is animated. The indicator turns
red if there are any errors during the retrieval process. Clicking this indicator opens the Error Log
window.
• Error messages (not illustrated): Error messages are displayed in the middle portion of the status
bar. Error messages are automatically cleared after displaying for 10 seconds. You can use the
Error Log window to retrieve old error messages.