
Web Tools User's Guide (Version 3.0)

4-8 Web Tools User’s Guide
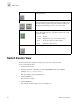
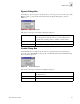
Switch View
4
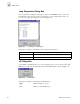
Fabric Watch View
You can use Fabric Watch View to monitor fabric elements for potential problem conditions. For
detailed information about Fabric Watch, see the Fabric Watch User’s Guide.
To access Fabric Watch View:
1. Launch the Web browser.
2. Enter the switch name or IP address in the Location/Address field and press Enter.
(Example: http://switch name/)
Web Tools launches, displaying Fabric View.
3. Click the Switch icon.
The Switch View displays.
4. Click the Watch icon.
The Fabric Watch View displays, with the Alarm Notifications tab (described in the following
section) selected by default.
Fabric Watch View contains the following tabs:
• Alarm Notifications
• Configure Thresholds
• Current Settings
In addition, an organizational tree appears on the left, showing all the Fabric Watch areas regardless
of which tab is selected. To expand or contract a folder in the tree, double-click the folder.
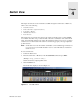
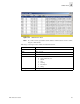
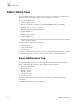
Alarm Notifications Tab
Use the Alarm Notifications tab to view the information for all elements of the Fabric Watch,
Fabric, or Performance Monitor classes. The information displayed includes
• The name of the threshold,
• The current value
• The last event type
• The last event time
• The last event value
• The last event state.
The Alarm Notification will refresh the displayed information according to the threshold
configuration.
The Alarm Notifications tab is shown in Figure 4-7.