
Web Tools User's Guide (Version 3.0)

4-4 Web Tools User’s Guide
Switch View
4
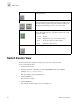
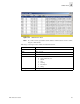
Switch Events View
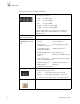
The Switch Events View displays a running log of events for the selected switch.
To access Switch Events View:
1. Launch the Web browser.
2. Enter the switch name or IP address in the Location/Address field and press Enter.
(Example: http://switch name/)
Web Tools launches, displaying Fabric View.
3. Click the Switch icon.
The Switch View displays.
4. Click the Events icon.
The Switch Events View displays as shown in Figure 4-2.
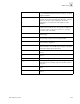
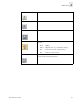
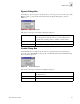
Perf Click to display the Performance Monitor where you can monitor
switch performance.
Beacon Click to turn on the beaconing function. If on, this icon shows
beams of light. The beaconing function helps to physically locate a
switch by sending a signal to the specified switch, resulting in an
LED light pattern flashing from side to side on the switch.
Temp Click to display temperature readings from all switch thermal
sensors. The background color of the button indicates the overall
temperature status:
Green - Healthy
Yellow - Marginal (mix of good and faulty readings)
Red - Down (more than two faulty readings)
Gray - Unknown or unmonitored
Info Click to display the switch information.