
Web Tools User's Guide (Version 3.0)


Web Tools User’s Guide 4-3
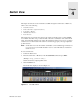
Switch View
4
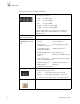
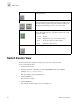
Events Click to access Switch Events View.
Telnet Click to launch a telnet session.
Fabric Watch Click to access Fabric Watch.
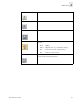
Fan The background color of the button indicates the overall status of
the fans:
Green - Healthy
Yellow - Marginal (mix of good and faulty readings)
Red - Down (more than two faulty readings)
Gray - Unknown or unmonitored
Admin Click to display the Administrative Interface where you can
perform switch management functions.