
Web Tools User's Guide (Version 3.0)

4-32 Web Tools User’s Guide
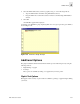
Switch View
4
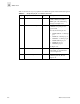
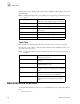
Table 4-3 describes the types of graphs that are available through the Advanced Monitoring menu.
Table 4-3 Graphs Displayed on an Advanced Canvas
Scope Graph Name Type Description
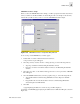
Switch SID/DID Performance Graph Line This graph charts the traffic between
a SID (or WWN) and a DID (or
WWN) pair on the switch being
managed. See Figure 4-37.
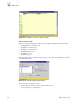
Switch SCSI Commands Graph Line The total number of Read/Write
commands on a given port to a
specific LUN.
Provides the following choices:
• SCSI Read/Write on a LUN per
port.
• SCSI Read on a LUN per port.
• SCSI Write on a LUN per port.
• SCSI Read/Write per port.
• SCSI Read per port.
• SCSI Write per port.
See Figure 4-39.
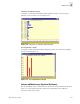
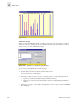
Switch SCSI vs IP Graph Vertical Bar Shows percentage of SCSI vs IP
frame traffic on each individual
port. See Figure 4-40.
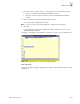
Switch ALPA Error Graph Line Displays CRC errors for a given
port and a given AL_PA. See
Figure 4-42.