
Web Tools User's Guide (Version 3.0)

4-30 Web Tools User’s Guide
Switch View
4
Port Error Graph
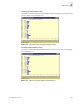
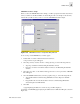
When you select the Port Error Graph, you will be prompted to chose the port that you want to
monitor for CRC errors. Figure 4-32 is an example of the data entry window that you will see when
you create a Port Error Graph.
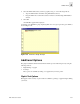
Figure 4-32 Port Error Setup Data Entry window
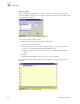
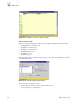
To choose the port that you want to graph:
1. Double-click on the folder in the Port Selection List window.
A drop down list of ports will appear.
2. Select the port that you want to monitor or change by using one of the following methods:
• Type the port number in the Enter /Drag Port Numbers window.
• Drag the port “file” from the Port Selection window to the Enter/Drag Port Number
window.
3. Select OK.
A graph displaying the CRC errors for the chosen port will be displayed.
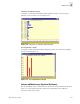
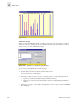
An example of a Port Error Graph, displaying a line of CRC errors for a given port, is shown in
Figure 4-33.
Figure 4-33 Port Error Graph Example