
Web Tools User's Guide (Version 3.0)

Web Tools User’s Guide 4-29
Switch View
4
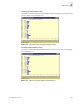
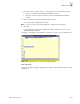
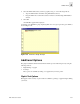
Switch Aggregate Throughput Graph
An example of a Switch Aggregate Throughput Graph, displaying the aggregate performance of all
ports of a switch, is shown in Figure 4-30
Figure 4-30 Switch Aggregate Throughput Graph Example
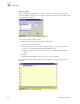
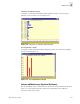
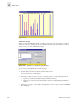
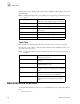
Switch Throughput Utilization Graph
An example of a Switch Throughput Utilization Graph, displaying a sample of the port throughput,
is shown in Figure 4-31.
Figure 4-31 Switch Throughput Utilization Graph Example