
Fabric Watch Monitoring in a DRM Environment - Application Notes

Notable Events to Monitor with DRM
Application Notes – Fabric Watch Monitoring in a DRM Environment 35
Monitoring Traffic Load Balances
Load balancing is desired when two or more long-distance links are used to provide site connections.
Each link can be monitored for a large data rate change that may be indicative of a link failure. A link
failure will cause the other links to assume the capacity of the link that failed and may lead to
saturation of some links.
Traffic can be monitored through the E_Ports on your long-distance links. To be meaningful,
knowledge of your normal traffic load is needed, which requires analyzing these numbers over a period
of time. The portperfshow Telnet command will display all port throughput (bytes transmitted and
received) for each switch port, during every second, while running. Low and high data rates will
become evident over time.
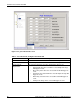
Thresholds can be configured for both receive (Rx) and transmit (Tx) performance measured in
kilobytes per second. Monitor the E_Ports you consider important by setting the threshold to
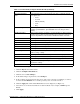
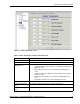
approximately 20% greater than your average high data rates. Refer to Figure 17 and Table 5 when
following the procedure below for monitoring traffic load:
1. Click the E_Port class under Switch.
2. Click the Configure Thresholds tab.
3. Click the box for Rx Performance (KB/s)
4. Click the behavior interval dropdown list, and select Second.
5. In the threshold type dropdown list, select Above.
6. In the High box, enter a threshold approximately 20% higher than the average high data rate for
that port.
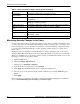
7. In the portState dropdown list near the bottom of the screen, select the port number you want to
monitor and click Enabled.
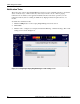
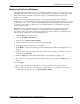
8. Click the Apply button. The Alarm Mechanism screen is displayed (see Figure 12).
9. Select the boxes for the desired methods of alarm notification (for example, SNMP Trap and
Email).
10. Click Apply.
11. Repeat steps 3 through 10 for all E_Ports you want to monitor for receive performance.
12. Repeat steps 3 through 10 for every E_Port you want to monitor for transmit performance by
changing the box clicked in step 3 to Tx Performance (KB/s).