
Fabric Watch Monitoring in a DRM Environment - Application Notes

Notable Events to Monitor with DRM
Application Notes – Fabric Watch Monitoring in a DRM Environment 33
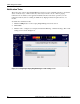
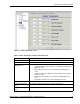
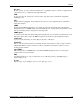
Figure 18: Fabric Thresholds screen
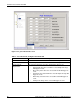
Table 6: Fabric Thresholds, Configure Thresholds Tab
Field Description
Low text box Enter the lowest number of occurrences that are acceptable.
High text box Enter the highest number of occurrences that are acceptable.
Threshold Type
dropdown list
Select the threshold type from this dropdown list. Options are:
• Out-Ranged: Any value outside the selected High/Low range will
trigger an event.
• Above: Any value above the selected threshold will trigger an
event.
• In-Between: Any value within the selected High/Low range will
trigger an event.
• Below: Any event below the selected threshold will trigger an
event.
• Changed: A change in the counter will trigger an event.
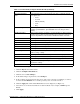
E-Ports Down Area Checking box will monitor E-Port status.
Fabric Reconfigured
Area
Checking box will monitor changes to fabric configuration.
Domain ID Changed
Area
Checking box will monitor forcible domain ID changes.