
Fabric Watch Monitoring in a DRM Environment - Application Notes
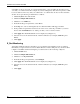

Notable Events to Monitor with DRM
32 Application Notes – Fabric Watch Monitoring in a DRM Environment
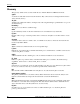
Some link loss may be expected on your long-distance lines, so they should be monitored for losses
over what you consider normal. For example, if you have an IP gateway that seldom experiences a link
loss more than two times a day, then you would want to set a threshold to monitor for more than this
amount. To set up monitoring for this link loss condition:
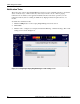
1. Click the E_Port class under Switch.
2. Click the Configure Thresholds tab.
3. Click the box for Link Loss.
4. In the threshold type dropdown list, select Above.
5. In the High box, enter 2, meaning that any more than this number will trigger an alarm.
6. In the portState dropdown list near the bottom of the screen, select the port number you want to
monitor and click Enabled. Do not enable ports that you do not wish to monitor.
7. Click Apply. The Alarm Mechanism screen is displayed (see Figure 12).
8. Select the boxes for the desired methods of alarm notification (for example, SNMP Trap and
Email).
9. Click Apply.
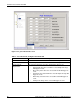
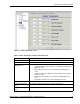
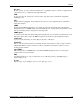
E_Port Monitoring
Your fabric is linked together by the E_Ports of your switches. E_Port failures need to be realized
immediately to begin corrective action. Use Fabric Watch to monitor all E_Ports in your fabric. Refer
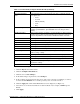
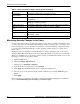
to Figure 18 and Table 6 when following the procedure below for the monitoring of E_Ports:
1. Click the Fabric class.
2. Click the Configure Thresholds tab.
3. Click the box for E_Ports Down.
4. In the threshold type dropdown list, select Changed.
5. Click Apply. The Alarm Mechanism screen is displayed (see Figure 12).
6. Select the boxes for the desired methods of alarm notification (for example, SNMP Trap and
Email).
7. Click Apply.