
Fabric Watch Monitoring in a DRM Environment - Application Notes

SNMP Management Station
26 Application Notes – Fabric Watch Monitoring in a DRM Environment
SNMP Management Station
To effectively monitor the status of a device, its component objects, and their attributes, Compaq
recommends that a management station be installed. One management station recommended and
discussed here is the Compaq Insight Manager XE. The Fabric Watch agents can send health status to
the Compaq Insight Manager. The Compaq Insight Manager interprets the health data into useful
information, then reports on the device status, creates events and trap reports on device conditions, and
performs a specific set of actions on managed devices.
As part of the installation, the Compaq Insight Manager performs an automatic discovery to determine
the IP address of the machine on which it is installed and the range of IP addresses for other machines
it will manage. Once installed, the Compaq Insight Manager is accessed remotely through a web
browser or locally from the host. To view a device remotely, enter the device URL with the port :280.
For example, enter the following URL in the browser address field:
http://device:280/
where device is the IP address or the computer name of the management server.
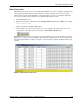
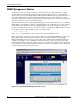
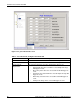
Figure 14 shows the Overview screen that appears when the Compaq Insight Manager is started. The
Device Status field contains the number of devices that are registered with the Compaq Insight
Manager XE databases. Devices are grouped by their status condition. Each underlined number in a
column is a hyperlink to a more detailed list of devices that belong to this device status query. The
Uncleared Event Status field lists the number of devices by type that have generated events. Events are
grouped by their event type. Each underlined number in a column is a hyperlink to a more detailed list
of events that belong to this event status query.
Figure 14: Compaq Insight Manager Overview Screen