
Fabric Watch Monitoring in a DRM Environment - Application Notes
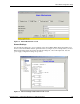

Fabric Watch Configuration Setup
22 Application Notes – Fabric Watch Monitoring in a DRM Environment
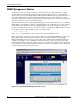
Fabric Watch View
Fabric Watch View (which requires an active Fabric Watch license to access) monitors fabric elements
for potential problem conditions. To access Fabric Watch View:
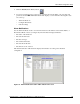
1. Launch the Web browser.
2. Enter the switch name or IP address in the Location/Address field and press Enter. For example:
http://switch name/
Web Tools launches, displaying Fabric View as shown in Figure 5.
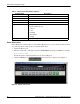
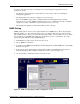
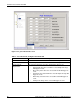
3. Click the Switch button. The Switch view is displayed (see Figure 9).
Figure 9: Switch View screen
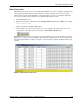
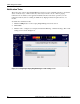
Table 4: Fabric Events Column Descriptions
Column Name Description
Switch Name of switch
Number Event number for affected switch
Time Time of event
Count Number of consecutive occurrences of same event
Level Severity level of event:
0—panic (switch reboots)
1—critical
2—error
3—warning
4—information
5—debug
Message Description of event