
Fabric Watch Monitoring in a DRM Environment - Application Notes
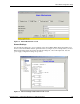

Fabric Watch Configuration Setup
Application Notes – Fabric Watch Monitoring in a DRM Environment 21
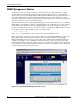
Fabric Events View
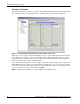
The Fabric Events View screen is accessed through the Fabric View screen (see Figure 5). Fabric View
is the first Web page that displays when connected to a switch, and it provides access to specific
information about each switch. In addition, a legend and other options are provided that explain the
colors used to indicate switch status. To access the Fabric Events View screen:
1. Launch the Web browser.
2. Enter the switch name or IP address in the Location/Address field and press Enter. For example:
http://switch name/
Web Tools launches, displaying Fabric View.
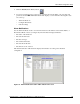
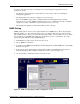
3. On the Fabric View screen, notice that there is a control panel on the left side and one or more
switch panels to the right. On the control panel, click the Fabric Events button.
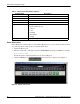
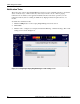
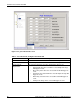
The Fabric Events View screen that appears provides a running log of events in the fabric as shown in
Figure 8. To sort the events by a particular column click the column header. To resize a column, drag
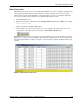
the column divider. Table 4 contains a description of the information found in the Fabric Events view
columns.
Figure 8: Fabric Events view screen