SANworks by Compaq Application Notes – Fabric Watch Monitoring in a DRM Environment Part Number: AA-RQ7PA-TE First Edition (May 2002) Product Version: ACS Version 8.6-4P Fabric Watch Version 3.0 This document describes how to activate and configure Fabric Watch to monitor important fabric and switch events in a SANworksTM Data Replication Manager by Compaq environment.
© 2002 Compaq Information Technologies Group, L.P. Compaq, the Compaq logo, Compaq Insight Manager, SANworks, and StorageWorks are trademarks of Compaq Information Technologies Group, L.P. in the U.S. and/or other countries. Microsoft, Windows, and Windows NT are trademarks of Microsoft Corporation in the U.S. and/or other countries. All other product names mentioned herein may be trademarks of their respective companies. Confidential computer software.
Application Notes Contents Application Notes Contents These application notes cover the following major topics: • The DRM Fabric, page 3 • Fabric Watch Overview, page 4 • Fabric Watch Activation, page 11 • Fabric Watch Configuration Setup, page 13 • SNMP Management Station, page 26 • Notable Events to Monitor with DRM, page 29 • Glossary, page 36 Intended Audience This document is intended for system administrators running SANworks Data Replication Manager (DRM) who desire to configure and mo
Fabric Watch Overview Additional hardware to support extra storage devices is needed at remote sites to allow a business to quickly resume processing in the case of a disaster at the primary site. This all demonstrates the importance of monitoring the fabric to quickly identify potential problems before a network component fails. These application notes address the use of Fabric Watch to monitor a fabric and some of its devices.
Fabric Watch Overview The elements that Fabric Watch monitors are grouped as follows: • Fabric events (such as topology reconfigurations and zone changes) • Switch environment (such as fans, power supplies, and temperature) • Ports (state changes, errors, and performance) • Gigabit Interface Converters (GBICs) for switches equipped with smart GBICs The version of Fabric Watch installed on your switch corresponds with the switch firmware version or version of the fabric operating system.
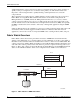
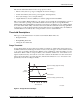
Fabric Watch Overview Rising/Falling Thresholds A rising/falling threshold has only one boundary, and a value is tracked as to whether it is on the desired side of that boundary (see Figure 3). An event will register when the counter value exceeds a boundary from a desired range. Rising/falling thresholds are typically used for rate-based counters.
Fabric Watch Overview Element Categories Fabric Watch elements are the hardware devices (hosts, routers, switches, and so on) of the fabric or switch that are monitored. The Fabric Watch software categorizes similar elements it monitors into classes, and each class has areas or behaviors that are observed. Classes The fabric and switch elements are organized into classes that are groupings of closely related elements.
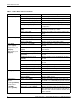
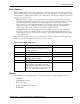
Fabric Watch Overview Table 1: Fabric Watch Classes and Areas Class Fabric (fabric) Area Area Description Loss of E_Port (ED) Monitors E_Port status Fabric reconfiguration (FR) Monitors fabric reconfiguration changes Segmentation changes (SC) Monitors segmentation changes Domain ID changes (DI) Monitors forcible Domain ID changes Zoning changes (ZC) Monitors changes to currently enabled zoning configuration Fabric to Quickloop changes (FQ) Monitors ports to detect changes from fabric to Quick
Fabric Watch Overview Event Policies Whenever Fabric Watch detects that a threshold is exceeded (a counter is above an upper boundary or below a lower boundary), an event is generated. Two types of event policies control the behavior of the event and can be configured with a Telnet session. The policies of an area are configured to be either a triggered or continuous event. • Triggered event—A single event is registered when a boundary is exceeded.
Fabric Watch Overview SNMP Trap A large SAN may already have SNMP monitoring software in place to monitor system hardware and software. Fabric Watch simplifies the integration of a StorageWorks SAN switch into the monitoring process by providing a convenient SNMP front-end configurator.
Fabric Watch Activation SNMP Management Stations An SNMP management station allows a SAN manager to: • Query the MIB variable for individual fabric and switch elements • Query and modify threshold and alarm configurations • Receive generated SNMP traps when threshold conditions are met • Be notified of important events Two different management stations are mentioned briefly in this document.
Fabric Watch Activation 3. Enter the following on the command line: licenseAdd “key” where key is the license key you have been provided, surrounded by double quotes. The license key is case sensitive and must be entered exactly as issued. 4. Verify the license was added by entering the following command: licenseShow If the license does not appear, repeat step 3. Activating the License Key through Web Tools To activate Fabric Watch using Web Tools, perform the following steps: 1.
Fabric Watch Configuration Setup Figure 6: Lic Admin display in Admin View screen Fabric Watch Configuration Setup Four user interfaces can be used to configure the Fabric Watch software: • Telnet • Web Tools • SNMP-based management stations • The configuration file Of these, the Telnet and Web Tools interfaces are detailed in this document. A brief explanation of how to use the configuration file with Telnet is also provided.
Fabric Watch Configuration Setup • Query and modify threshold and alarm configurations. Use the Telnet command fwConfigure to view the default and customized settings. • Upload and download the configuration file through the configUpload and configDownload commands. After the Fabric Watch license is activated, the software runs based on the default settings. These default settings cannot be altered. Instead, custom settings are assigned and Fabric Watch is configured to use those settings.
Fabric Watch Configuration Setup Configure Threshold Boundaries Configure threshold boundaries to establish the behaviors that will trigger events. NOTE: Only custom settings can be changed. To configure threshold boundaries, perform the following steps: 1. Open a Telnet session to your switch. 2. Enter the fwConfigure command. A list of Fabric Watch classes appears as shown in Example Display 2.
Fabric Watch Configuration Setup 4 : advanced configuration 5 : return to previous page Select choice => : (1..5) [5] 5. Select advanced configuration (option 4) to view configurable boundaries. See Example Display 5.
Fabric Watch Configuration Setup Example Display 6 Select choice => : (1..19) [19] 1 Select threshold index => : (0..14) [0] 3. Select the index number of the threshold to configure. As shown in Example Display 5, indexes 0 and 10 through 14 correspond to six configurable E_Ports. After selecting an E_Port index number, the resulting screen prompts you for a behavior type as shown in Example Display 7. Example Display 7 1 : triggered 2 : continuous Enter behavior type => : (1..
Fabric Watch Configuration Setup Configure Alarms Configure alarms to define the ways Fabric Watch responds to each event. When alarms are configured, the custom alarm configuration is changed. After changing the alarm configuration, the changes must be applied to use the custom settings. Alarms are configured by choosing the type of alarm that each event type will trigger. Fabric Watch uses a binary matrix to assign a numerical value to each alarm.
Fabric Watch Configuration Setup 2. Select Set Mail Address for Email Alert (option 5).
Fabric Watch Configuration Setup Configure SNMP Agent The SNMP agent is configured to identify who should receive trap messages and their level of access control. To access the Web Tools GUI, perform the following steps: 1. Launch the Web browser. 2. Enter the switch name or IP address in the Location/Address field and press Enter. For example: http://switch name/ Web Tools is launched, displaying Fabric View (see Figure 5). 3. Click the Admin View button displayed. on the desired switch control panel.
Fabric Watch Configuration Setup Fabric Events View The Fabric Events View screen is accessed through the Fabric View screen (see Figure 5). Fabric View is the first Web page that displays when connected to a switch, and it provides access to specific information about each switch. In addition, a legend and other options are provided that explain the colors used to indicate switch status. To access the Fabric Events View screen: 1. Launch the Web browser. 2.
Fabric Watch Configuration Setup Table 4: Fabric Events Column Descriptions Column Name Description Switch Name of switch Number Event number for affected switch Time Time of event Count Number of consecutive occurrences of same event Level Severity level of event: 0—panic (switch reboots) 1—critical 2—error 3—warning 4—information 5—debug Message Description of event Fabric Watch View Fabric Watch View (which requires an active Fabric Watch license to access) monitors fabric elements for pot
Fabric Watch Configuration Setup 4. Click the Watch (Fabric Watch) button. 5. A login screen will appear if you have not logged into the network. Enter your user name and password, and click OK.
Fabric Watch Configuration Setup Configure Thresholds Use the Configure Thresholds tab to view and configure Fabric Watch thresholds for the Fabric Watch class currently selected in the organizational tree on the left side of the window (see Figure 11). Figure 11: Environmental Thresholds tab in Fabric Watch view screen The class type (for example, environmental, SPF, port, and so on) determines the threshold values that can be changed.
Fabric Watch Configuration Setup Figure 12: Alarms Mechanisms screen Current Settings Use the Current Settings tab to view a summary of the current Fabric Watch threshold parameters for the area selected in the Fabric Watch organizational tree (see Figure 13). For example, when you select Environment under Switch, then select the Current Settings tab, a list of all temperature, fan, and power supply configuration settings are provided.
SNMP Management Station SNMP Management Station To effectively monitor the status of a device, its component objects, and their attributes, Compaq recommends that a management station be installed. One management station recommended and discussed here is the Compaq Insight Manager XE. The Fabric Watch agents can send health status to the Compaq Insight Manager.
SNMP Management Station In order to send and receive traps, a managed object for the management application must be configured correctly: • The managed object must have a trap destination to direct traps to the server running the management application. • The management server must be configured to receive the traps. • The correct SNMP security must be established between the management device and the management server, using SNMP community strings, a type of authentication.
SNMP Management Station Notification Tasks The monitor bar on the Compaq Insight Manager Overview screen continually refreshes to update the status of critical, major, or minor events. If you are away from the console, e-mail or paging notification can be enabled, or the application launch task can be activated to perform your own notification method (such as sounding an audible alert). Paging notification requires the use of a modem. To enable these notification tasks: 1.
Notable Events to Monitor with DRM Managing MIBs Compaq Insight Manager XE is used to perform the most common SNMP functions. These functions include: • Registration of new Compaq and third-party MIBs • Modification of registered MIBs and related browsing of all MIB variables • Deletion of obsolete or unused MIBs • Uploading new MIBs to be registered • Use of trap categories for organization and event queries To obtain MIB files for your switch: 1. Go to http://www.compaq.com/storage/siteindex.
Notable Events to Monitor with DRM Figure 17: E_Port Thresholds screen Table 5: Port Thresholds, Configure Thresholds Tab Field 30 Description Low text box Enter the lowest number of occurrences that are acceptable. High text box Enter the highest number of occurrences that are acceptable. Threshold Type dropdown list Select the threshold type from this dropdown list. Options are: • Out-Ranged: Any value outside the selected High/Low range will trigger an event.
Notable Events to Monitor with DRM Table 5: Port Thresholds, Configure Thresholds Tab (Continued) Field Threshold Sampling Rate Description Select the time period of the interval for the port you want monitored. The options are: • None • Second • Minute (default) • Hour • Day portState dropdown list Select the port number for which you want to configure thresholds (for example, portState000 or eportState000 refer to the first port in the switch).
Notable Events to Monitor with DRM Some link loss may be expected on your long-distance lines, so they should be monitored for losses over what you consider normal. For example, if you have an IP gateway that seldom experiences a link loss more than two times a day, then you would want to set a threshold to monitor for more than this amount. To set up monitoring for this link loss condition: 1. Click the E_Port class under Switch. 2. Click the Configure Thresholds tab. 3. Click the box for Link Loss. 4.
Notable Events to Monitor with DRM Figure 18: Fabric Thresholds screen Table 6: Fabric Thresholds, Configure Thresholds Tab Field Description Low text box Enter the lowest number of occurrences that are acceptable. High text box Enter the highest number of occurrences that are acceptable. Threshold Type dropdown list Select the threshold type from this dropdown list. Options are: • Out-Ranged: Any value outside the selected High/Low range will trigger an event.
Notable Events to Monitor with DRM Table 6: Fabric Thresholds, Configure Thresholds Tab (Continued) Field Description Segmentation Changed Area Checking box will monitor segmentation changes. Zone Changed Area Checking box will monitor changes to currently enabled zoning configuration. Fabric<->QL Area Checking box will monitor ports to detect changes from fabric to Quickloop or Quickloop to fabric. Fabric Logins Area Checking box will monitor number of host device fabric logins (FLOGIs).
Notable Events to Monitor with DRM Monitoring Traffic Load Balances Load balancing is desired when two or more long-distance links are used to provide site connections. Each link can be monitored for a large data rate change that may be indicative of a link failure. A link failure will cause the other links to assume the capacity of the link that failed and may lead to saturation of some links. Traffic can be monitored through the E_Ports on your long-distance links.
Glossary Glossary This glossary defines terms associated with the use of Fabric Watch in a DRM environment. agent A software module that reside in network elements. They collect and store management information on the element (device). AL_PA Arbitrated Loop Physical Address. A unique 8-bit value assigned during loop initialization to a port in an arbitrated loop. boundary The upper or lower limit of a defined range. CRC Cyclic redundancy check. A check for transmission errors included in every data frame.
Glossary NL_Port Node Loop Port. A node port that has arbitrated loop capabilities. Used to connect an equipment port to the fabric in a loop configuration through an FL_Port. SAN Storage area network. A network of systems and storage devices that communicate using Fibre Channel protocol. SFP Small form factor pluggable. An optical transceiver used to convert signals between optical fiber cables and switches. SNMP Simple Network Management Protocol.