
FW 07.00.00/HAFM SW 08.06.00 McDATA Sphereon 4500 Fabric Switch Installation and Service Manual (620-000159-320, April 2005)

Diagnostics
4-33
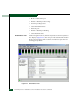
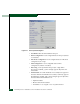
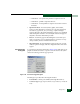
Each port bar graph in the upper portion of the view displays the
instantaneous transmit or receive activity level for the port, and is
updated every five seconds. The relative value displayed is the
greater of either the transmit or receive activity (whichever value is
greatest when sampled).
Each port graph has 20 green-bar level indicators corresponding to
5% of the maximum throughput for the port (either transmit or
receive). If any activity is detected for a port, at least one green bar
appears. A red indicator on each port bar graph (high-water mark)
remains at the highest level the graph has reached since the port was
set online. The indicator does not appear if the port is offline, and is
reset to the bottom of the graph if the port detects a loss of light.
When the mouse cursor is passed over a port bar graph (flyover), the
graph highlights with a blue border and an information pop-up
displays the port operational state or WWN of the attached device.
Click a port bar graph to display statistics values for the port.
Right-click a port bar graph to open a pop-up menu to:
•Open the Port Properties dialog box (Figure 4-23 on page 4-36).
•Open the Port Technology dialog box (Figure 4-24 on page 4-37).
• Block or unblock the port.
• Enable or disable port beaconing.
• Perform port diagnostics.
• Clear link incident alerts.
• Reset the port.
• Enable or disable port binding.
•Clear threshold alerts.
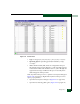
The page displays the following tables of cumulative port statistics
and error count values for a selected port:
• Class 2 statistics - These entries provide information about Class
2 traffic, including:
— Class 2 frames received and transmitted.
— Four-byte words received and transmitted.
— Busied and rejected frames.