
FW 07.00.00/HAFM SW 08.06.00 McDATA Sphereon 4500 Fabric Switch Installation and Service Manual (620-000159-320, April 2005)

4-20
McDATA Sphereon 4500 Fabric Switch Installation and Service Manual
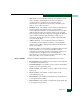
• Date/Time - Date and time the alert occurred.
• Name - Name for the alert as configured through the Configure
Threshold Alerts dialog box.
• Port - Port number where the alert occurred.
• Type - Type of alert: transmit (Tx) or receive (Rx).
• Utilization % - Percent usage of traffic capacity. This setting
constitutes the threshold value and is configured through the
Configure Threshold Alerts dialog box. For example, a value of 25
means that threshold occurs when throughput reaches 25 percent
of the port’s capacity.
• Interval - Time interval during which the throughput is measured
and an alert can generate. This is set through the Configure
Threshold Alerts dialog box.
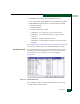
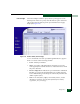
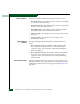
Open Trunking Log To open the Open Trunking Log, select the Open Trunking Log option
from the Logs menu at the Hardware View, Port List View, Node List
View, Performance View, or FRU List View. The log displays
(Figure 4-17).
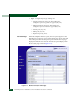
Figure 4-17 Open Trunking Log
The log displays ISL congestion events that cause Fibre Channel
traffic to be routed through an alternate ISL. Entries reflect the traffic
re-route status at the managed switch. The log consists of the
following columns:
• Date/Time - Date and time the re-route action occurred.
• Receive Port - The switch port number (decimal) used for
receiving Fibre Channel traffic after the re-route action.
• Target Domain - The domain ID (decimal) of the target device to
which Fibre Channel traffic from the switch was rerouted.