
FW 07.00.00/HAFM SW 08.06.00 McDATA Sphereon 4500 Fabric Switch Installation and Service Manual (620-000159-320, April 2005)

4-16
McDATA Sphereon 4500 Fabric Switch Installation and Service Manual
Fabric Log To open the Fabric Log, select the option from the Monitor and Logs
menus. The log reflects the time and nature of changes made to a
managed fabric. This information is useful for system administrators
and users. For a log description, refer to the SANavigator Software
Release 4.0 User Manual (621-000013).
Element Manager
Logs
To open a log from the Element Manager application, select the Logs
menu at any view, then click (select) the desired log option.
Sphereon 4500 Audit
Log
To open the Sphereon 4500 Audit Log, select the Audit Log option from
the Logs menu at the Hardware View, Port List View, Node List View,
Performance View, or FRU List View. The log displays a history of user
actions performed through the Element Manager application or a
simple network management protocol (SNMP) management
workstation. This information is useful for system administrators and
users. For a log description and an explanation of button functions,
refer to the McDATA Sphereon 4500 Fabric Switch Element Manager User
Manual (620-000175).
Sphereon 4500 Event
Log
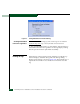
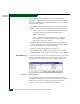
To open the Sphereon 4500 Event Log, select the Event Log option from
the Logs menu at the Hardware View, Port List View, Node List View,
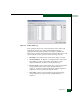
Performance View, or FRU List View. The log displays (Figure 4-13).
Figure 4-13 Sphereon 4500 Event Log
The log displays a history of switch events, such as degraded
operation, FRU failures, FRU removals and replacements, port
problems, Fibre Channel link incidents, and management server-to-
switch communication problems. The information is useful to
maintenance personnel for fault isolation and repair verification.