
FW 07.00.00/HAFM SW 08.06.00 McDATA Sphereon 4500 Fabric Switch Installation and Service Manual (620-000159-320, April 2005)

4-14
McDATA Sphereon 4500 Fabric Switch Installation and Service Manual
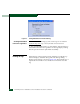
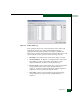
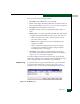
Figure 4-11
Event Log
The log displays SNMP trap events, client-server communication
errors, and other problems recorded by the SAN management
application. Information provided is generally intended for use by
third-level support personnel to fault isolate significant problems.
The log consists of the following columns:
• Date/Time - Date and time the event occurred.
• Event - Event number and brief description of the event. Include
this information when reporting an event to customer support.
• Product - The product associated with the event and configured
name or internet protocol (IP) address associated with the
instance are displayed.
• Data - Additional event data for fault isolation. Include this
information when fault isolating a call-home problem, or include
the information when reporting an event to customer support.
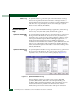
Session Log To open the Session Log, select the option from the Monitor and Logs
menus. The log displays a session (login and logout) history for
the SAN management application. This information is useful for
system administrators and users. For a log description, refer to the
SANavigator Software Release 4.0 User Manual (621-000013).
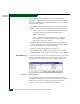
Product Status Log To open the Product Status Log, select the option from the Monitor and
Logs menus. The log displays (Figure 4-12).