
FW 07.00.00/HAFM SW 08.06.00 McDATA Sphereon 4500 Fabric Switch Installation and Service Manual (620-000159-320, April 2005)

3-96
McDATA Sphereon 4500 Fabric Switch Installation and Service Manual
6
At the management server, does a yellow triangle (attention indicator)
appear adjacent to a Fibre Channel port graphic at the Hardware
View (Figure 3-10 on page 3-20)?
YES NO
↓ The problem is transient and the switch-to-fabric element
connection appears operational. Exit MAP.
7
Inspect the port state and LED status for all ports with an attention
indicator.
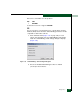
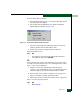
a. At the Hardware View, double-click the port graphic with the
attention indicator. The Port Properties dialog box displays.
b. Inspect the Operational State field at the Port Properties dialog
box.
Does the Operational State field indicate Segmented E_Port?
YES NO
↓ Analysis for other port or link incident problems is not
described in this MAP. Go to MAP 0600: Port Failure and Link
Incident Analysis on page 3-74. Exit MAP.
8
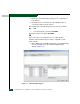
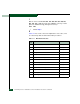
Inspect the Reason field at the Port Properties dialog box. Table 3-15
lists port segmentation reasons and associated steps that describe
fault isolation procedures.
Build fabric protocol error. Go to step 18.
No principal switch. Go to step 20.
No response from attached switch (hello timeout). Go to step 21.
Table 3-14 Port Segmentation Reasons and Actions (SANpilot)
Segmentation Reason Action